Cumulative Volume Delta with VWAP-based Buy/Sell AlertsDescription:
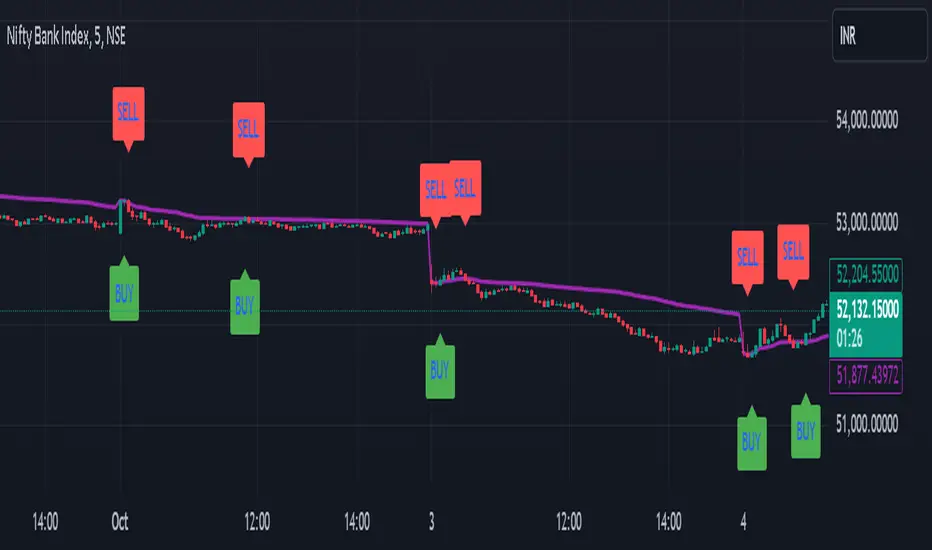
This script combines Cumulative Volume Delta (CVD) with Volume Weighted Average Price (VWAP) to generate buy and sell signals. It plots both the cumulative volume delta and its moving average on the chart, but the actual buy and sell signals are now based on the crossover and crossunder of the price with the VWAP, a popular tool for tracking price relative to the volume-weighted average over time.
Features:
Cumulative Volume Delta (CVD) Plot:
CVD helps visualize the net buying or selling pressure by accumulating volume when the price is rising and subtracting it when the price is falling. The cumulative volume is plotted on the chart as a blue line.
Moving Average of CVD:
A simple moving average (SMA) of the cumulative volume delta is plotted in orange to smooth out fluctuations and help detect the trend of volume flow.
VWAP Calculation:
VWAP (Volume Weighted Average Price) is a standard benchmark widely used in trading. It gives insight into whether the price is trading above or below the average price at which most of the volume has traded, weighted by volume. The VWAP is plotted as a purple line on the chart.
Buy/Sell Signals Based on VWAP:
Buy Signal: Triggered when the price crosses above the VWAP, indicating potential upward momentum.
Sell Signal: Triggered when the price crosses below the VWAP, signaling potential downward momentum.
These signals are displayed on the chart with clear labels:
Buy Signal: A green upward label appears below the price.
Sell Signal: A red downward label appears above the price.
Alerts for Buy/Sell Conditions:
Alerts are built into the script, so traders can receive notifications when the following conditions are met:
Buy Alert: The price crosses above the VWAP.
Sell Alert: The price crosses below the VWAP.
Use Case:
This script is useful for traders looking to incorporate both volume-based indicators and the VWAP into their trading strategy. The combination of CVD and VWAP provides a more comprehensive view of both price and volume dynamics:
VWAP helps traders understand whether the price is trading above or below its volume-weighted average.
CVD highlights buying or selling pressure through cumulative volume analysis.
Customization:
Anchor Periods: The user can customize the anchor period to suit different timeframes and trading styles.
Custom Alerts: The alert conditions can be easily modified to integrate into any trader’s strategy.
This script can be adapted for both short-term and long-term trading strategies and is especially useful in high-volume markets.
How to Use:
Add the script to your TradingView chart.
Customize the timeframe and anchor period, if needed, to match your preferred trading style.
Watch for Buy/Sell signals based on price crossing the VWAP.
Set up alerts to receive notifications when Buy or Sell signals are triggered.
This script is designed to help traders make informed decisions based on both price action relative to volume and Cumulative Delta volume trends, giving a more comprehensive view of the market dynamics.
"Buy sell" için komut dosyalarını ara
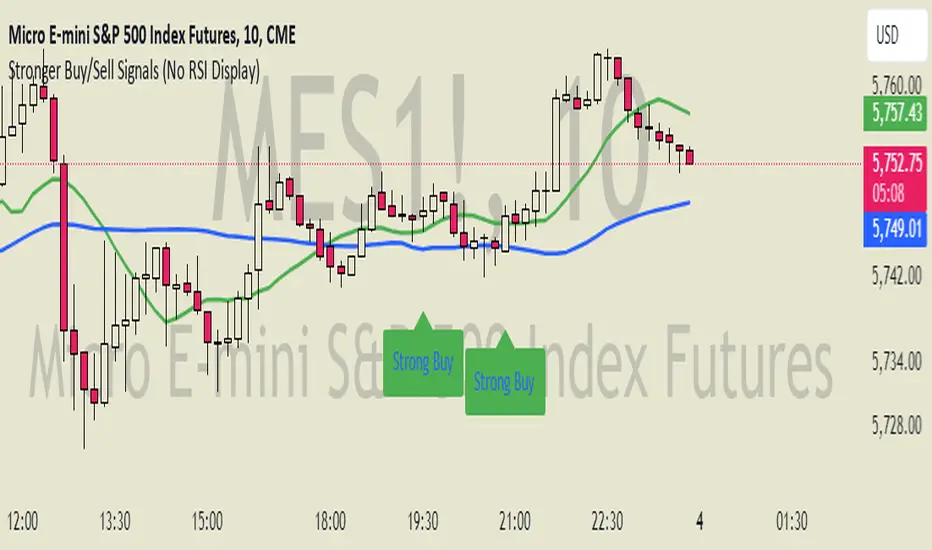
Stronger Buy/Sell Signals This custom Pine Script indicator is designed to detect strong buy and sell signals based on price action trends and momentum, with an emphasis on using two simple moving averages (SMAs) for trend identification and RSI (Relative Strength Index) impulses for additional confirmation. The script is optimized to ensure that signals are not triggered too frequently, only highlighting strong trend-based opportunities. Additionally, the script is built as an overlay to keep the chart clean and prevent any visual shrinking caused by extra indicators.
Key Features
1. Moving Averages (SMAs):
- 11-period SMA (short-term trend): This moving average is used to track short-term price movement and serves as the primary trend filter.
- 50-period SMA (medium-term trend): This moving average is used to track the medium-term price trend, providing additional confirmation for trend direction.
The price must be above both SMAs for a buy signal or below both SMAs for a sell signal, ensuring that signals are only triggered in well-defined trends.
2. RSI Momentum Confirmation:
- Although the RSI is not displayed on the chart, it plays a critical role in filtering the signals.
- The RSI is calculated using the standard 14-period formula, and an additional condition requires that the RSI must show an upward or downward momentum (impulse) for buy or sell signals, respectively.
- The RSI impulse is measured by comparing the RSI value to its 5-period moving average:
- Upward impulse for a buy signal.
- Downward impulse for a sell signal.
3. Buy Signal:
- A strong buy signal is triggered when:
- The price is above both the 11-period and 50-period SMAs (confirming a bullish trend).
- The RSI is showing upward momentum, implying growing buying pressure.
- When both of these conditions are met, a green "Strong Buy" label will appear below the price bars, indicating a strong buying opportunity.
4. Sell Signal:
- A strong sell signal is triggered when:
- The price is below both the 11-period and 50-period SMAs (confirming a bearish trend).
- The RSI is showing downward momentum, implying growing selling pressure.
- When both of these conditions are met, a red "Strong Sell" label will appear above the price bars, indicating a strong selling opportunity.
5. No RSI Display:
- While the RSI is used for internal signal filtering, it is not displayed on the chart. This decision ensures that the chart remains uncluttered, with only the important buy/sell signals and moving averages visible.
6. Overlay-Only Indicator:
- This script is designed as an overlay indicator, meaning it plots directly on the price chart without adding additional panes. This helps the chart maintain its size and avoids shrinking the view.
---
Use Case
This indicator is ideal for traders who want to:
- Focus on strong, trend-confirming signals while avoiding noise from weaker setups.
- Trade in alignment with the trend , as defined by both short-term (11-SMA) and medium-term (50-SMA) price action.
- Filter signals based on momentum without cluttering their charts with additional indicators.
Customization Options
- SMA Periods : You can adjust the periods for the 11-SMA and 50-SMA depending on your preferred timeframe and trading strategy.
- RSI Conditions : If you want to add or remove sensitivity from the buy and sell signals, you can modify the RSI impulse logic to adjust the thresholds for what qualifies as an upward or downward impulse.
---
Conclusion
The "Stronger Buy/Sell Signals" Pine Script is a powerful trend-following tool that uses a combination of moving averages and RSI momentum to generate reliable trading signals. The indicator is designed to help traders stay in strong trends, while filtering out weaker signals that don't meet strict criteria. By not displaying the RSI directly and keeping the chart focused on key signals, this script maintains a clean and functional trading setup.
This indicator is best used by traders who prefer clear visual guidance for buying and selling opportunities, especially in trending markets.
---
Feel free to adjust the parameters to suit your specific trading style! Let me know if you'd like any additional features or modifications.
Supertrend (Buy/Sell) With TP & SLSupertrend (Buy/Sell) with TP & SL: An Enhanced Trading Tool
This Pine Script indicator combines the popular Supertrend indicator with multiple take-profit (TP) and stop-loss (SL) levels, providing traders with a comprehensive visual aid for potential entries, exits, and risk management.
Originality
Buffer Zones for Precision: Instead of relying solely on the Supertrend line, this script incorporates buffer zones around it. This helps filter out false signals, especially in volatile markets, leading to more accurate buy/sell signals.
Flexible Stop-Loss: Offers the choice between a fixed or trailing stop-loss, allowing traders to tailor their risk management approach based on their preferences and market conditions.
Multiple Take-Profit Levels: Provides three potential take-profit levels, giving traders the flexibility to secure profits at different stages of a trend.
Heikin Ashi Candles & VWAP: Incorporates Heikin Ashi candles for smoother trend visualization and adds a VWAP line for potential support/resistance levels.
Clear Table Display: Presents key information like Stop Loss and Take Profit levels in a user-friendly table, making it easier to track trade targets.
How It Works
Supertrend Calculation: The Supertrend is calculated using ATR (Average True Range) to gauge market volatility. The script then creates buffer zones around the Supertrend line for refined signal generation.
Buy/Sell Signals:
Buy: When the close price crosses above the upper buffer zone, indicating a potential uptrend.
Sell: When the close price crosses below the lower buffer zone, suggesting a potential downtrend.
Take Profit & Stop Loss:
Take Profits: Three TP levels are calculated based on ATR and a customizable profit factor.
Stop Loss: The stop-loss can be set as either a fixed value based on ATR or as a trailing stop-loss that dynamically adjusts to lock in profits.
How To Use
Add the Indicator: Search for "Supertrend (Buy/Sell) With TP & SL" in the TradingView indicators list and add it to your chart.
Customize Inputs: Adjust parameters like ATR Period, Factor, Take Profit Factor, Stop Loss Factor, Stop Loss Type, etc., based on your trading style and preferences.
Interpret Signals: Look for buy signals when the price crosses above the upper buffer and sell signals when it crosses below the lower buffer.
Manage Risk: Use the plotted Take Profit and Stop Loss levels to manage your risk and potential rewards.
Concepts
Supertrend: A trend-following indicator that helps identify the direction of the prevailing trend.
ATR (Average True Range): A measure of market volatility.
Buffer Zones: Used to filter out false signals by creating a zone around the Supertrend line.
Trailing Stop Loss: A dynamic stop-loss that moves with the price to protect profits.
Heikin Ashi: A type of candlestick chart designed to filter out market noise and make trends easier to identify.
VWAP (Volume Weighted Average Price): An indicator that shows the average price at which a security has traded throughout the day, based on both volume and price.
Important Note: This script is for educational and informational purposes only. Backtest thoroughly and use with caution in live trading. Always manage your risk appropriately.

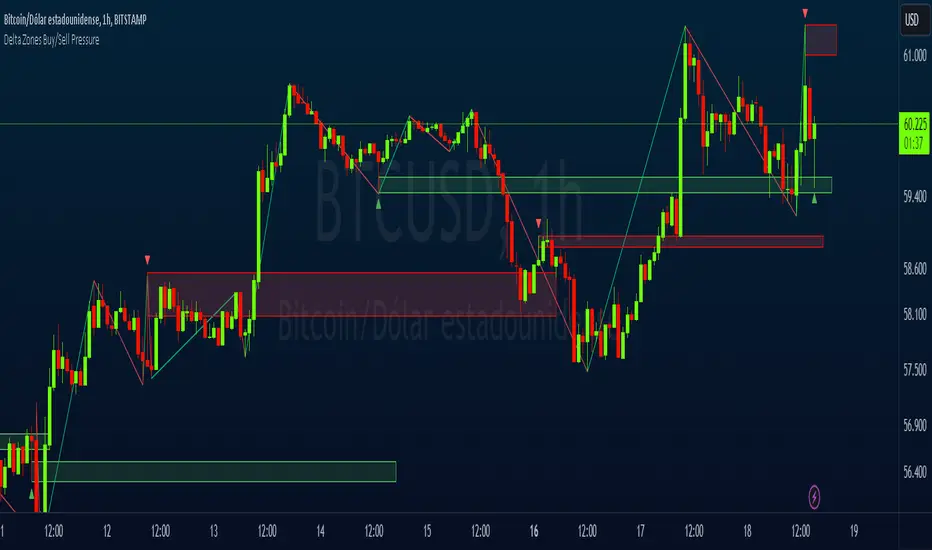
Delta Zones Buy/Sell PressureScript Description:
Delta Zones Buy/Sell Pressure Indicator
Description:
The "Delta Zones Buy/Sell Pressure" indicator, created by the original author "scarf", is a technical tool that unveils key areas of buying and selling pressure in the market. This indicator utilizes the concept of Delta, calculating differences between open, close, high, and low prices. When these differences exceed a threshold determined by the user-defined standard deviation, areas of intense buying (indicated by green boxes) and selling pressure (indicated by red boxes) on the chart are identified.
How It Works:
The indicator calculates Delta using various combinations of candle prices to determine buying and selling pressure. When Delta surpasses a certain level, indicated by the user-defined standard deviation, visual signals in the form of boxes on the chart are generated. These boxes highlight specific areas where buying or selling pressure is particularly strong, aiding traders in identifying potential entry and exit points in the market.
How to Use:
* When a green box is drawn, it indicates strong buying pressure in the market. This can be interpreted as a signal to consider long positions.
* When a red box is drawn, it indicates strong selling pressure in the market. This can be interpreted as a signal to consider short positions.
* Use these signals in combination with your own analysis and risk management strategies to make informed trading decisions.
Originality:
What makes this indicator original is its unique approach to identifying specific areas of buying and selling pressure. By calculating Delta in multiple ways and utilizing standard deviation as a filter, this indicator provides clear and concise visual signals about market activity. The combination of these features distinguishes it as a valuable tool for traders seeking a better understanding of market behavior. This modification differs from the original by displaying the information on the price chart with horizontal bars, below each delta, instead of an oscillator at the bottom similar to the volume indicator.
Final Recommendations:
Consider Market Trends:
Before making any trading decisions using the Delta Zones Buy/Sell Pressure Indicator, it is crucial to analyze the prevailing market trends. Assess the overall direction of the market, whether it's trending upward, downward, or moving sideways. Align your trades with the dominant trend to increase the probability of successful outcomes. The indicator's signals can be more reliable when they align with the broader market trend.
Evaluate Macro-Economic Factors:
Additionally, take into account macro-economic factors that could influence price movements. Factors such as economic indicators, geopolitical events, interest rate decisions, and global market sentiments can significantly impact the financial markets. Stay updated with relevant news and economic reports to anticipate potential market shifts. Understanding the broader economic context can help you interpret the indicator's signals within a more informed framework.
Practice Risk Management:
Regardless of the signals provided by the Delta Zones Buy/Sell Pressure Indicator, always implement effective risk management strategies. This includes setting stop-loss orders, diversifying your portfolio, and only risking a small percentage of your trading capital on each trade. By managing your risk, you can protect your investments and ensure longevity in the market, even during volatile periods.
Continuous Learning and Adaptation:
Financial markets are dynamic and constantly evolving. Continuously educate yourself about new trading strategies, technical analysis tools, and economic developments. Stay open to adapting your trading approach based on changing market conditions. Regularly reviewing your trading strategy and adjusting it according to your experiences and market feedback can significantly enhance your trading performance over the long term.
Seek Professional Advice if Necessary:
If you are uncertain about specific market trends, indicators, or economic factors, don't hesitate to seek guidance from financial advisors or professionals. Their expertise can provide valuable insights and help you make well-informed decisions, especially in complex or uncertain market environments.
By incorporating these recommendations into your trading approach, you can enhance your decision-making process, mitigate risks, and increase your overall chances of successful trading outcomes. Remember, the key to successful trading lies not only in the tools you use but also in your ability to interpret them within the broader market context.
YinYang VolumeOverview:
YinYang Volume is an Advanced Volume Indicator. Regular Volume can be deceiving. It can be hard to tell how much of the Volume bar is Buy vs Sell volume, especially since the bar is green or red simply based on if it closes at a greater price than it opened. With YinYang Volume you'll be able to see how much Buy AND Sell Volume there is on each bar. Being able to see both is very useful, but the cherry on top is the Buy and Sell Moving Average Lines. These lines (White is Buy and Orange is Sell) can show who is currently winning the fight, Bulls or Bears. When the lines cross it's a shift in momentum and when combined with other technical analysis you can better understand the direction the market is moving and make an informed and educated trading decision. YinYang Volume also has Information tables, these tables display the Buy vs Sell volume on different Timeframes. This way even if you're trading on a Low Timeframe (like 15 minutes) you can see how the Buy vs Sell volume is fairing on other Timeframes.
Tutorial:
Unlike most volume indicators, including standard volume, we can see both Buy AND Sell volume for each bar. You may be wondering, well what’s the importance of this? The answer is EVERYTHING! Volume is one of the most important indicators when it comes to trading. Nothing moves without volume. However, with standard volume, the bar is either red or green simply based on if it closes greater than it opens. Now, that is pretty silly if you ask us. Let’s get into depth as to why seeing both Buy and Sell volume is important, and examples for how you can make trades with it:
In this example above, we have 2 green bars and they both have high levels of volume. This bar on the right however, has more volume than the one on the left. The issue here is, the bar on the right has MORE Sell volume than it even does have Buy volume; meanwhile the bar on the left has way more buy volume than the bar on the right with little sell volume. Without separating them and by simply looking at the price bar and regular volume bar, we would never be able to deduce this. It is crucial to understand and see how much of each volume there is as it plays a huge role in the price movements.
The white line represents the Buy Volume Moving Average and the orange line represents the Sell Volume Moving Average. These moving averages are very useful as when they cross they represent strong Buy and Sell Signals.
We’ve enabled signals which plot circles onto the MA’s to display when they’ve crossed. The white circle represents a Buy Signal and the Orange circle represents a Sell Signal. These signals are very strong, but there is a catch that comes with it. The bar right after the signal has the highest chance of a reversal so it isn’t always advised to make the trade until confirmed that the reversal didn’t happen on the following bar. If you have enough data based on other technical analysis to know the first signal is true, then use it as a way to solidify the fact that it is a good entry/exit location.
You can change the length of which the MA’s are smoothed out over. For instance, in the previous examples and by default the length is 14. However, if we are to change it to 50 for instance, it makes them a longer lasting MA that has much fewer crosses. This can be useful based on your trading style and if you prefer to stay in trades for quite awhile. As you can see, all signals with the 50 length are quite accurate and would have produced profitable trades, likely more so than at 14, but since it moves slower there's fewer signals to trade on.
Our Information Tables are there to show you the amount of Buy vs Sell %’s on 6 different Time Frames at the same time. It can be very useful to know how people are feeling on different Time Frames without you having to change your own. This way you can stay on say the 15 minute Time Frame locked in your trade and can see if the momentum of your long trade is cooling down based on higher Time Frames Buy vs Sell volume %’s.
For example, let's say you got an alert from YinYang Volume for Buy Signal on the 1 Day. You then entered a trade which you deemed a good location on the 15 minutes (after doing your own technical analysis on the 15 minute too). The Buy vs Sell Volume %’s on the 1 Day was 55% Buy and 45% Sell when you entered the trade. You are still waiting for exit confirmation on the 15 minute but you notice the Buy vs Sell Volume % on the 1 Day goes down to 52% Buy and 48% Sell. You can see the momentum changing. Even though you haven’t received confirmation for exit on the 15 minute, it may still be a good time to get out as momentum is clearly changing on the 1 Day.
We will conclude this Tutorial here. We hope you’ll get some good use out of our Volume Indicator and its ability to display unique Volume Data. If you have any Questions, Comments, Suggestions or Concerns, please don’t hesitate to contact us.
Settings:
1. Show Signals:
Toggling this setting shows when the Buy and Sell Volume MA’s cross each other. It produces a white circle when the Buy Volume Crosses over the Sell Volume (BULLISH) and an orange circle when the Sell Volume Crosses over the Buy Volume (BEARISH).
2. Length:
How far back should we average the Buy and Sell Volume Moving Averages? 14 is default has been tested and proven to work well, however you can change it if there is a different value that suits your trading style better.
3. Type:
How is the Moving Averages calculated? VWMA (Volume Weighted Moving Average) is the default as it has been tested and worked best; afterall, we are calculating volume and therefore should use a volume weighted MA calculation. However, you can change it as your options are:
VWMA, EMA and SMA
4. Information Tables:
4.1. Show Information Tables:
Our Information tables display 6 different resolutions so you can see how much Buy vs Sell volume there is as a % in multiple different Time Frames without having to change your Time Frame.
4.2. Strength:
The Buy / Sell Volume %’s displayed within your Information Tables are based on Moving Averages. The length this moving average uses is based on the Strength you select. The strengths aren’t as simple as just a length amount but are a calculation involving multiple different lengths and averages. However, the stronger the strength, generally the farther the lookback length is as an average. Your options for strength are:
Unbreakable
Very Strong
Strong
Average
Weak
Very Weak
Glass
We recommend ‘Average’ Strength, however if you find you want to see the %’s change more or less frequently you can adjust to your trading style
4.3. Res1 / Res2/ Res3 / Res4 / Res5 / Res6:
These represent the different resolutions (Time Frames) being used in your information tables and can be modified to display whatever resolution works best for your trading style. By default they are:
Res1: Current Timeframe
Res2: 15 Minute
Res3: 1 Hour
Res4: 4 Hour
Res5: 1 Day
Res6: 1 Week
Backup Res (not changeable): 5 Minute (this is only used if your Current Timeframe in Res1 is a duplicate of one of the other resolutions)
HAPPY TRADING!

YinYang RSIYinYang RSI is a Momentum Oscillator. It is loosely based on the standard RSI but uses our Custom True Value Zone Algorithm. Essentially it is a stronger, more accurate RSI that isn't manipulated by consolidation. YinYang RSI moves slightly slower than the standard RSI but when it does move it is much more accurate.
Why do we deem YinYang RSI to be a more accurate RSI? Well, let's discuss some of the underlying logic behind it. YinYang RSI is derived from the High and Low data from multiple Security Requests, we send that data into a modified Donchian Channel to calculate its Basis. That basis is then taken and averaged between multiple different VWMA calculations to ‘Smooth’ it out before we send it into an RSI calculation and display the final results.
This may sound a little confusing and you may be wondering, why bother doing this? The main reason we created the YinYang RSI is to remove the fact that consolidation causes Regular RSI to go down in index value. In our opinion RSI shouldn’t go down due to consolidation. By removing consolidation from RSI it innately made the RSI more smooth and since it became more smooth there were less times it crossed the RSI Moving Average (MA). In turn, since it crosses the RSI MA less, it means when it does cross the RSI MA, it is a much stronger more accurate signal; but don’t just take our word for it! Let’s get into some examples to show you exactly how it works:
Our RSI is very smooth, because of the way we apply VWMA to it, it keeps it from being a jagged line like the regular RSI is:
Our Indicator features 3 RSI’s in it: YinYangRSI, Regular RSI and YinYang Stoch RSI. The reason there are 3 is not only for the Information Tables (we will talk about this later), but also for the fact that you can overlay them on top of each other.
Here is the same dates but with Regular RSI:
Hopefully you can see how different they are and how smooth ours is, but if not, lets overlay them so you get a better idea:
When the YinYang RSI and Regular RSI are overlaid on top of each other, the Regular RSI’s colors change for easier readability. The Regular RSI turns Pink and the Regular RSI MA turns Orange. As you can see here, they function much differently and it is quite clear that the YinYang RSI holds itself during consolidation and is more smooth.
You may be asking yourself, this is great and all, but how does it help me trade?
Well, now that you understand the difference between YinYang and Regular RSI let's discuss exactly that!
So as you can see in the image above, when the RSI crosses the RSI MA it represents a strong movement in price is likely about to occur. When the RSI is very low (20 or less) and it crosses ABOVE the RSI MA, this represents a BUY/LONG signal. When the RSI is very high (80 or above) and it crosses BELOW the RSI MA, this represents a SELL/SHORT signal.
There are times where it is a good time to buy or sell, but the RSI may not be in the right place. This is rare but it does happen. We marked a location that did exactly that with an Orange circle in the picture above. These things happen, however we don’t recommend you act on them. The main reason is that they are much more risky. Nothing will ever be 100% accurate, but the key is making decisions that are more in your favor than not. When the RSI and RSI MA cross and the RSI is near 50, it's much less accurate, however, not impossible for it to be a good signal.
Now you may be wondering, how come I see 2 SELL or 2 BUY signals before the RSI moves a lot? This is quite normal. Based on the picture above, all of the BUY and SELL signals are accurate, but not all of them have insane price movements. However, they all did feature SOME price movements. Just because a BUY or SELL (RSI and RSI MA crossing) happens, doesn’t mean the RSI is going to move all the way from 80 to 20, sometimes the price only moves a bit and then corrects back. This is completely normal.
The part that is up to you is knowing when to exit these trades. You can use the YinYang RSI to see entry locations for Long/Short, but it can be risky to assume that you can go from a BUY right to a SELL and vice versa.
Don’t fret, there is a reason we have our YinYang Stoch RSI within this indicator and its not just because we felt like it! When you overlay the YinYang RSI and YinYang Stoch RSI on top of each other, you can get a very good idea of when a signal may be over and likely it’s a good time to get out. However, first, just so you understand what our YinYang Stoch RSI does, let's take a quick look at it.
At first glance, the YinYang Stoch RSI can look pretty strange and even overwhelming, this is completely normal. It features drastic movements, but only when there is good reason to! When the blue line (K) crosses the orange line (D) it represents momentum in price. So when the blue line crosses above the orange line it means BUY and when the blue line crosses below the orange line it means SELL.
How it works with the YinYang RSI is simple, lets toggle the two of them on together in the settings:
It may look a little confusing at first, and we don’t necessarily recommend you do it for your entry as it can be a little too much and sometimes confusing, but it can be very helpful for understanding your exit and if the momentum has changed/died down. Here's an example based on our initial BUY/SELL image above:
So since we’re talking about the double SELL signal and how to know if its momentum is ending we’ve zoomed in on this example. Here we can see where the pink circle is, that the YinYang Stoch RSI has gained buy momentum and the sell momentum has likely ended here. This is canceled out however, by the fact that shortly after we see another SELL signal combined with the Stoch RSI crossing under and also showing SELL momentum. The blue Vertical lines are to show visually where the stoch crossed over/under as they can be a little hard to see visually. Also, based on this example, you can see where the orange circle is that was clearly a very good buy location and also has the stoch crossover in that location too. So even though the RSI isn’t very low, there is still a decent amount of bullish momentum in that location. Is this enough for you to make a purchase on? In our opinion, it’s still a little too risky, but maybe it fits your trading style, or maybe you decide its a good time to Dollar Cost Average / purchase just a small amount.
Now, you may be wondering, as we mentioned it early, what are those Information Tables that have been sitting on the right of every example?
These Information Tables are there to display very important Time Frame data for you. Not only can you see 6 Different Time Frames, which you can customize within your Settings. You also get to see the level of RSI and RSI MA for YinYang, Regular and YinYang Stoch RSI. Being able to see this data on multiple different Time Frames without having to change the Time Frame you are on can be very helpful, especially if you’re trading on a lower Time Frame like 15 minutes. The color of the box is based on if the RSI has crossed the MA or not. When the box is Green, the RSI is greater than the MA (Bullish). When the box is Red, the RSI is less than the MA (Bearish).
This concludes our Tutorial on how to use YinYang RSI, below you will see all of our current Settings, what they all mean and how you can customize them.
Settings:
1. Show Signals:
Signals are when the RSI crosses the RSI MA (for any RSI TYPE active). When these crosses happen, it will make a plot on the chart that represents Buy and Sell Signals. These signals have alerts that correspond with them, but you will manually need to set up these alerts yourself through the indicator. Please refer to TradingView for how to set up alerts.
2. RSI Type:
We have 3 types of RSI’s within this Indicator:
YinYang RSI
Regular RSI
YinYang Stoch RSI
These RSI’s can be used individually or overlaid on top of each other for easier comparison. It can be useful to go back and forth between indicators or have them overlaid to get a better understanding of what's going on.
2.1. YinYang RSI:
Our YinYang RSI is our custom RSI that is based on our True Value Zone Algorithm. It is the main purpose of this Indicator but can be used in conjunction with Regular RSI and YinYang Stoch RSI. YinYang RSI is a much more smooth, slow moving form of RSI that doesn’t go down from consolidation and therefore makes the RSI and RSI MA crosses much more accurate.
2.2. Regular RSI:
This is a regular RSI that is within our indicator so you can make comparisons and also overlay on top of our YinYang RSI and/or YinYang Stoch.
2.3. YinYang Stoch RSI:
This is a Stoch RSI that is calculated with our YinYang RSI’s values to create a very unique Stoch RSI. Our YinYang Stoch RSI moves very drastically and quickly when there is true momentum swings but it never really hovers in the middle. It makes its way from 0-100 and 100-0 within 2-3 candles usually and if it makes it all the way, you know there is momentum backing this price movement.
3. Information Tables:
3.1. Show Information Tables:
Our Information tables display 6 different Time Frame resolutions to give you the data of YinYang RSI/MA, Regular RSI/MA and Stoch RSI/MA over multiple different Time Frames so you don’t constantly have to keep changing yours and can focus on the trade at hand.
You can choose to display:
‘All’,
‘None’,
‘YinYang RSI’,
‘Regular RSI’,
‘YinYang Stoch RSI’
and/or any combination of the three so you can see all the data you want to your liking.
3.2. Display Tables Direction:
Since there are 6 different Time Frames shown, and you have the ability to display all 3 RSI and MA values, this table can get pretty big. If you have a large monitor and not too many indicators active it's no big deal and a vertical display is likely what you’ll want. However, if you have a smaller monitor or many Indicators active, it will scrunch this Indicator and make it difficult to see all of your Time Frames in the tables. For this reason, we have the option to display them ‘Horizontally’.
3.3. Res1 / Res2/ Res3 / Res4 / Res5 / Res6:
These represent the different resolutions (Time Frames) being used in your information tables and can be modified to display whatever resolution works best for your trading style. By default they are:
Res1: Current Timeframe
Res2: 15 Minute
Res3: 1 Hour
Res4: 4 Hour
Res5: 1 Day
Res6: 1 Week
Backup Res (not changeable): 5 Minute (this is only used if your Current Timeframe in Res1 is a duplicate of one of the other resolutions)
Alerts are available and customizable within the Indicator. You can set up an alert for any of the RSI crossing Signals.
If you have any Questions or Concerns, don’t hesitate to contact us.
HAPPY TRADING!

VANILLA BUY SELLThis script uses three components:-
USEFUL MA by @ALEXGROVER
SUPERTREND INDICATOR(3 supertrend with different ATR and multiplier) provided by tradingview.
VIX FEAR GAUGE by @bizkitbr
To make it easy and line free, supertrend lines have been removed but the color fill has been kept. This makes the chart clean.
For option traders, direction and momentum is everything. Hence, two need to be really clear:-
a) BUY OR SELL
b) Whether momentum exists of not
While rise is charecterised by a steady pace, a fall is charecterized by a rapid decline.
So in order to make the best use of of the charecters, a careful interpretation and backtesting has been done to enable buy sell only when vix conditions are met.
BUY SIGNAL
A buy signal is generated on following conditions:-
a)PRICE CLOSE ABOVE USEFUL MA
B)ALL THREE SUPERTRENDS ARE GREEN
C)VIXFIX IS BELOW 0.18.
SELL SIGNAL
This is generated when following is met:-
A) PRICE BELOW USEFUL MA
B)ALL THREE SUPERTRENDS ARE RED
C)VIXFIX IS ABOBE 0.18
ADDITIONALLY, A SMALL BACKGROUND COLOR CHANGE PROVIDED FOR AREAS WHERE THERE IS A BUY OR SELL.
Either labels can be used or background colours referred for seeing buy or sell.
HMA Breakout Buy/Sell indicator for Scalping & Intraday - ShyamHi All,
This is a very simple indicator which provides the buy signal, when the moving average lines turns Green and sell signal, when the moving average signal turns red. This can be used for both intraday and scalping method with different timeframes. But best time frame is 5 minutes.
Buy Signal >>> Line turns GREEN (Use trailing SL to cover maximum profit)
Sell Signal >>> Line turns RED (Use trailing SL to cover maximum profit)
No trade >>> Line turns GRAY
Best timeframe >>> 5 minutes
Thanks,
Shyam

KV Box v1.0 - Buy / Sell signalKV BOX is a trading indicator. It combines Darvas box theory (developed by Nicolas Darvas), breakout strategy, multi-timeframe trading and ALMA (Arnaud Legoux Moving Averages). This indicator helps identify BUY signals when the price is in the entry zone and SELL when the price breaks out of the uptrend.
---
How to use?
KV BOX can be used in both SPOT and FUTURE (Long/Short) trading
BUY (LONG):
• Entry: When the BUY signal appears.
• Stop loss: LOWER than LOW of first and second candlestick IN THE BOX WHERE BUY SIGNAL APPEARS of 1H, 4H, 1D timeframe.
• Take profit: When the SELL signal appears.
SELL (SHORT):
• Entry: When the SELL signal appears.
• Stop loss: HIGHER than the HIGH of first and second candlestick IN THE BOX WHERE SELL SIGNAL APPEARS of 1H, 4H, 1D timeframe.
• Take profit: When a BUY signal appears.
---
Attention:
KV BOX is only displayed on 1H, 4H and 1D timeframe. 1H for short-term trades (a few days), 4H for mid-term trades (a few weeks), 1D for long-term trades (weeks to months).
---
Options setting:
- Kelvin box on: KV BOX activates
- ALMA mode on: KV BOX activation according to Arnaud Legoux Moving Average (ALMA) method
- Pinbar indicator: activate the indicator when the pinbar candlestick appears
- Supertrend: trend continuation or reversal indicator
============================
KV BOX là 1 chỉ báo mua / bán kết hợp giữa nguyên lý hộp Darvas, phương pháp phá vỡ (break out), giao dịch đa khung thời gian và đường trung bình ALMA (Arnaud Legoux Moving Averages). Chỉ báo này giúp xác định tín hiệu mua khi giá ở vùng entry và bán khi giá phá vỡ khỏi trend tăng (up trend).
---
Cách sử dụng:
KV box có thể dùng trong giao dịch SPOT và FUTURE (Long/Short).
Mua khi có tín hiệu BUY, bán khi có tín hiệu SELL.
MUA:
• Entry: Khi có tín hiệu BUY.
• Cắt lỗ: thấp hơn giá thấp nhất cùa 2 nến đầu tiên trong hộp xuất hiện tín hiệu BUY của khung 1H, 4H, 1D.
• Chốt lời: Khi có tín hiệu SELL xuất hiện.
BÁN:
• Entry: Khi có tín hiệu SELL.
• Cắt lỗ: cao hơn giá cao nhất của 2 nến đầu tiên trong hộp xuất hiện tín hiệu SELL cùa khung 1H, 4H, 1D.
• Chốt lời: Khi có tín hiệu BUY xuất hiện.
---
Chú ý:
KV BOX chỉ hiển thị trên khung 1H, 4H và 1D. 1H cho giao dịch ngắn hạn (vài ngày), 4H cho giao dịch trung hạn (vài tuần), 1D cho giao dịch dài hạn (vài tuần đến vài tháng).
---
Tùy chọn setting:
- Kelvin box on: kích hoạt KV BOX
- ALMA method on: kích hoạt KV box theo phương pháp Arnaud Legoux Moving Averages (ALMA)
- Pinbar indicator: kích hoạt chỉ báo khi xuất hiện nến pinbar đảo chiều
- Supertrend: chỉ báo xu hướng tiếp diễn hoặc đảo chiều

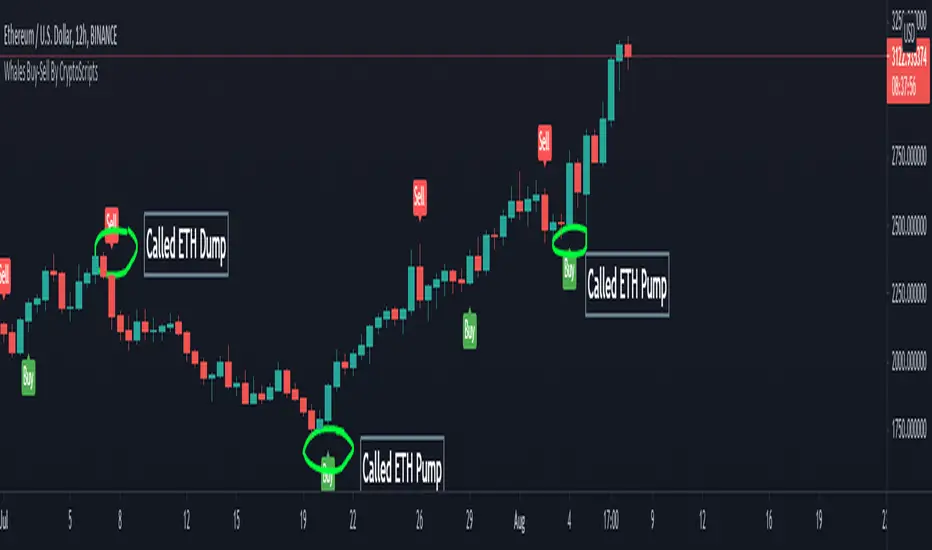
Whales Buy-Sell By CryptoScriptsThe Whales Buy-Sell indicator is very unique because it uses a combination of the smoothing range, average ranges, and hi-band/low-bands combined with various moving averages to nail whenever the overall trend is changing. This is extremely important during periods of high volatility and large moves. It helps to keep someone in a trade longer and get out fast if the trend is changing. The big caveat I can stress is waiting until the candle closes so that you know the signal is confirmed! Use the Bar Replay feature to further understand the intricacies of how the indicator produces signals. I find it is better on larger timeframes (1h and higher) because it's measuring larger trends. It can still be used on smaller timeframes but may not be as accurate. The big shortcoming is that is doesn't do well in choppy environments (i.e barely any price movement up or down) and you may get a lot of back and forth buy/sell signals so PLEASE keep that in mind. Experiment with various tickers/timeframes and see what works best for you :)
This indicator is a trend analysis indicator. Trend analysis is a technique used in technical analysis that attempts to predict future stock price movements based on recently observed trend data. Trend analysis is based on the idea that what has happened in the past gives traders an idea of what will happen in the future, but that is NOT always the case! Past performance is NOT indicative of future returns. There are three main types of trends: short-, intermediate- and long-term. Trend analysis tries to predict a trend, such as a bull market run, and then ride that trend until data suggests a trend reversal, such as a bull-to-bear market.
Alerts
You can set alerts for either a 'Buy Signal' or 'Sell Signal'. I recommend setting alerts for the candle close so that you know the signal is confirmed! If the "Add Alerts" option is greyed out for the indicator, just refresh your tradingview page and you should be able to see it :)
PM me to obtain access and please let me know if you have any questions!
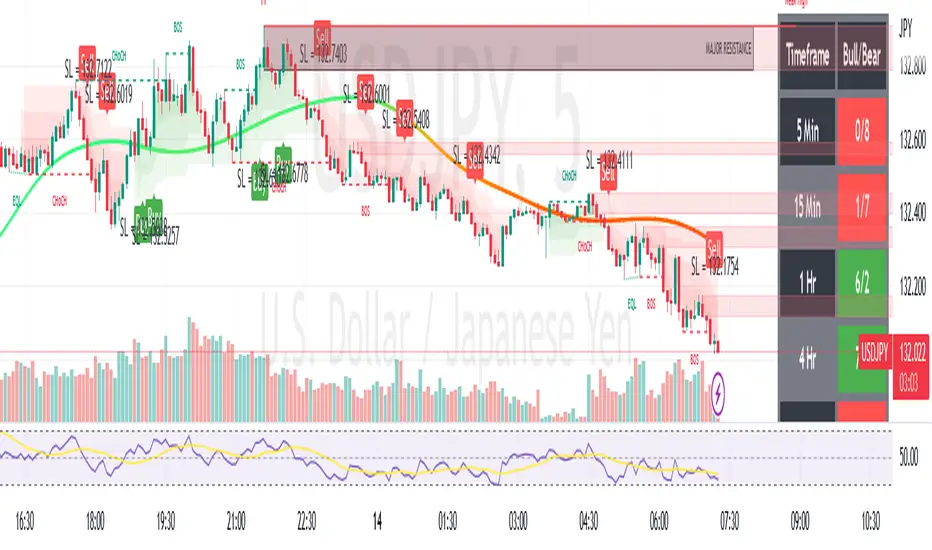
TDI - Traders Dynamic Index + RSI Divergences + Buy/Sell SignalsTraders Dynamic Index + RSI Divergences + Buy/Sell Signals
Credits to LazyBear (original code author) and JustUncleL (modifications)..
I added some new features:
1- RSI Divergences (Original code from 'Divergence Indicator')
2- Buy/Sell Signals with alerts (Green label 'Buy' - Red label 'Sell')
3- Background colouring when RSI (Green line) crosses above MBL (yellow line)
- Buy and Sell Signals are generated using Dean Malone's method (The Author of the TDI indicator) as mentioned in his PDF: (( www.forexfactory.com )), according to:
** Buy (Green Label) = RSI > 50, Red line, & Yellow line
** Sell (Red Label) = RSI < 50, Red line, & Yellow line
- I found that the best quality long trades generated when RSI crosses above red line, yellow line and they are all above 50, and vice versa for sell trades.
-I figured out another way to generate Buy/Sell Signals when RSI crosses above the yellow line, and you can stay with the trade till RSI crosses under the yellow line (I made a background colouring for that to be easily detected)
Hope you all wonderful trades..
مؤلف المؤشر هو (Dean Malone)
وكتب LazyBear كوده في tradingview
وأضاف JustUncleL بعض التعديلات عليه
أضفت إليه بعض المزايا الأخرى المتمثلة في:
1- رصد انحرافات مؤشر القوة النسبية
2- إشارات بيع وشراء بناء على طريقة مؤلف المؤشر
3- تظليل بالأخضر للمنطقة التي يعبر فيها مؤشر القوة النسبية الخط الأوسط (الخط الأصفر)
إشارات البيع والشراء تكون كالتالي:
** الشراء عندما يكون مؤشر القوة النسبية فوق الخط الأحمر وفوق خط الـ 50 وفوق الخط الأصفر
** البيع عندما يكون مؤشر القوة النسبية تحت الخط الأحمر وتحت خط الـ 50 وتحت الخط الأصفر
** أفضل إشارات الشراء حينما يعبر مؤشر القوة النسبية فوق الخط الأحمر والأصفر، ويكونوا جميعا فوق خط الـ 50، والعكس بالنسبة لإشارات البيع
يمكن استخدام المؤشر في دخول صفقات متوسط المدى، وذلك عندما يعبر مؤشر القوة النسبية فوق الخط الأصفر (قمت بتظليل المنطقة بالأخضر لسهولة رصدها) والخروج من الصفقة إذا نزل مؤشر القوة النسبية عن الخط الأصفر،
يرجى التنبه إلى أن الدخول والخروج يكون بأسباب فنية مدروسة، والمؤشر يدعم قراراتك فقط، ولا يمكن الاعتماد عليه منفردا في تحديد نقاط الدخول أوالخروج.
تجارة موفقة لكم جميعا :)

Day's Buy Sell Volume label
This indicator looks simple but it was bit tricky to code and to make it work on all time frames .
I have used array in this to showcase the use of array, array give you more flexibly.
It works on all time frame 1m 2m 3m 5m 10m 15m 30m 60m 120m.
When the time frame is greater than the or equal to "D" it will show the current bar volume only.
Total volume is made up of buying volume and selling volume. Buying volume is the number of shares, contracts, or lots that were associated with buying trades, and selling volume is the number that were associated with selling trades.
This indicator shows two labels green one is showing the buying volume of the current day and the red label is showing the selling volume of the current day.
I am making this code available to all.
This code is for Total volume is made up of buying volume and selling volume. Buying volume is the number of shares,
contracts, or lots that were associated with buying trades, and selling volume is the number that were associated with selling trades.
//thanks to @Doc6272 who asked to make this indicator Label

SEOCO - BUY/SELL indicatorThis scripts is based on RSI , Stoch RSI and some other indicators.
It provides a BUY and SELL label when loading the script and gives you also the possibility to set a BUY, SELL or BUY/SELL alert.
This script has been designed to do some swing trading on daily candles. After some adjustments it also gives a good result on the 5 minute candles.

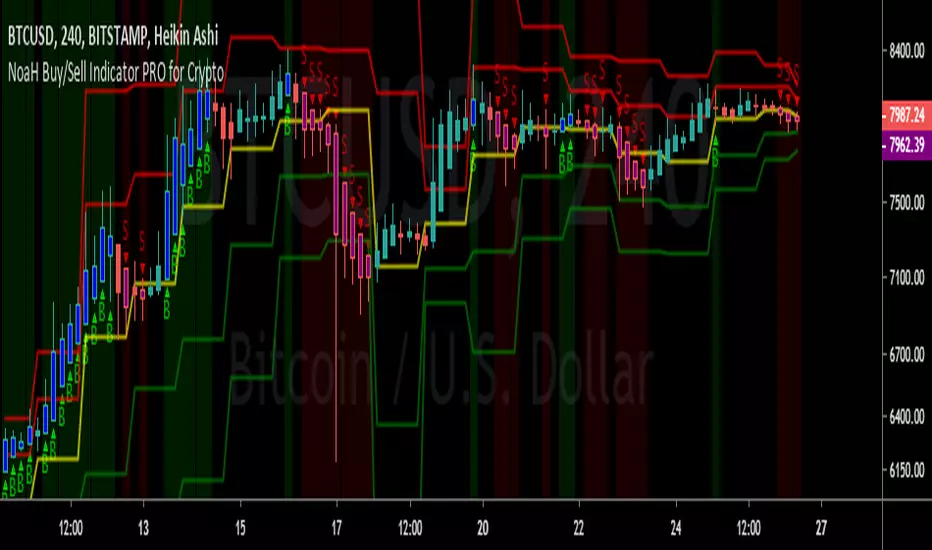
NoaH Buy/Sell Indicator PRO for Crypto Noah Crypto introduces an improved specified version Buy/Sell indicator for cyptocurrency market.
- This indicator can work for all pairs on all exchanges but for CRYPTO MARKET ONLY. Don't use it for margin trading or other markets.
- This indicator was optimized for Heikin Ashi chart, so please use it on Heikin Ashi charts only. Wrong chart may lead to wrong signals.
- This indicator shows best performance at M30, H4 and D1. So it is very suitable for day traders or scalp traders.
BENEFITS OF THIS VERSION:
- Show Buy/Sell zones: Good buy zone are 3 first candles marked with 'B' letter, close/exit buy on first 'S' candle confirmed.
- Targets and stop-loss are shown directly on chart. Buy/Sell areas have Green/Red background.
- No 'B' or 'S' marked on candles indicates the undecided market, wait for trend to be more clear to put orders.
- Applicable to set alarm when a coin reaches entry, sell targets or stop-loss.
PM me for 1 day trial and monthly fee, or if you have question or need support.
NICE X v1 - Buy/Sell & TP Signals *FREE V.* -- by @cryptomrdavisThis is my tool for you guys,
still in development and not 100% guarantee that every signal bringst you 20%-50% profit, but it helps to make some gains and to safe from a bigger price drop.
You get "Buy" and "Sell" signals, and you can manually set up to 3 take profit points. There is some issue i need to fix, but for now it works pretty well. I recommend to use on trading pairs with good volume and on higher timeframes, signals get weak if there is low volume .
If anyone has some ideas how to reduce these noise, get at me so i can improve this tool.
Happy trading!
Buy / Sell signals
Take Profit Signals (default values 5%,10% & 15%
Set Alerts on Buy/Sell signals
*** use this tool on your own risk ***
--------------------------------------------------------------------------------------------------------
If my tool helped you out, get at me
BTC: 1GVRDK3HHr9CKM5SF2CGpCNXFuavB3L4j9
ETH: 0x7b825fa752b9926D3E8397cDb1d9E5473D074646
XLM GAXUQJSW55C7MAC4GI26NZUGIKSHFDVFRFKZCXPLMPY4HCADSDT55XK6
BCH: qz57n04ud6mn42u00aymqkku8tfh0lk4jv9c28mjvv
--------------------------------------------------------------------------------------------------------

Trader Set - Buy Sell PowerThis is an original oscillator I Developed for my methodology, the Idea and base thought of formula came from MACD, we all know that momentum, if being set correctly, is a leading indicator and actually, it's one of few real leading indicators, keeping that in mind a heavy R&D was done and the result is a formula that can show the momentum of buyers or sellers in the market, for buying momentum, the formula is totally different than selling momentum, but knowing that the correlation is there, I added both formulas into one oscillator that would be easy to understand and use in my methodology.
Please don't contact me for the access, access is given only to my students, the English version of the website and learning material is under development. As soon as they are ready, I will announce it under every related script in comment section.

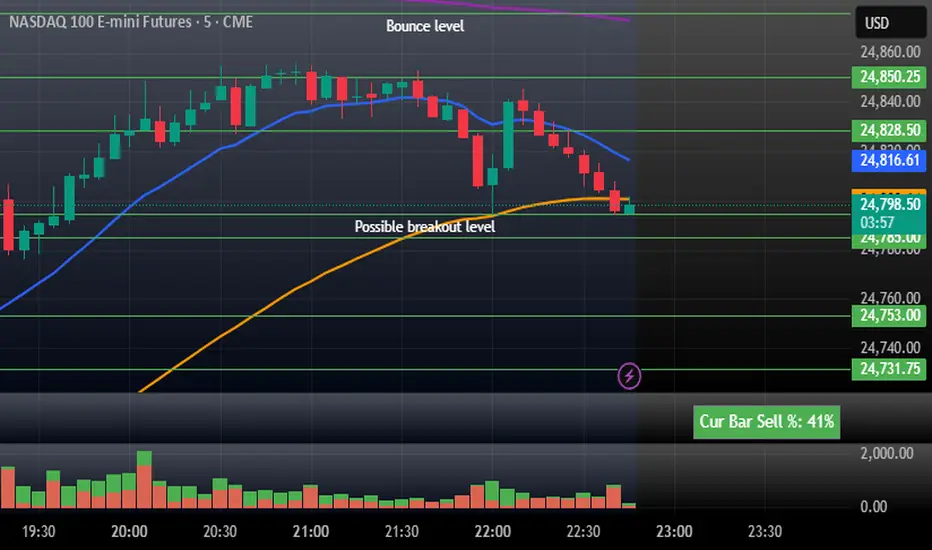
CustVolumeStudy - Stacked Buy/Sell + Sell% (top-right)Current Bar Sell + Stacked Buy/Sell. This indicator helps tell the story of momentum on the current bar. If the % is high then it is bearish. Low it is bullish.
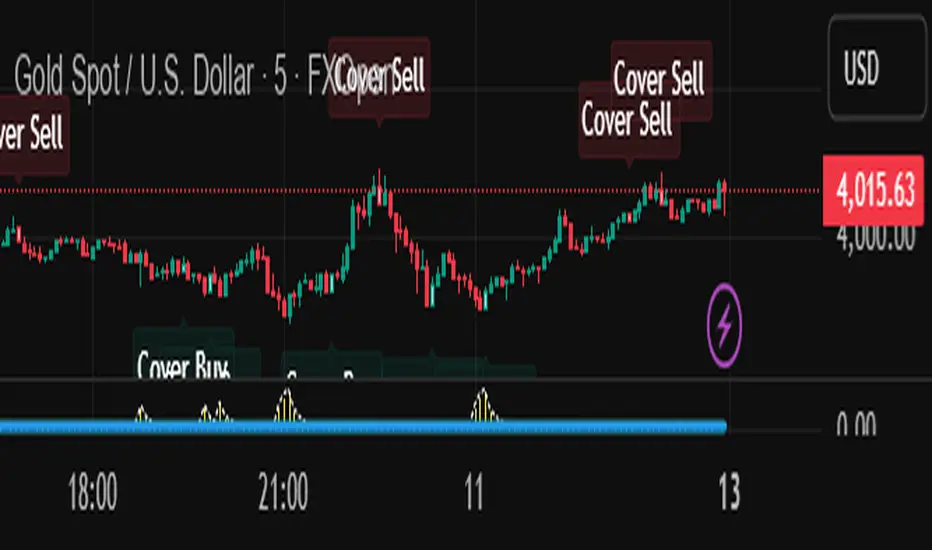
[NBK] Cover Buy Sell Cover Buy Sell — Engulfing Reversals with EMA/ATR Trend & Quality Filters
What it does
This indicator flags high-quality bullish/bearish reversal candles only when they align with a short-term trend and pass several objective quality filters. It is not a simple mashup: each component serves a distinct role and they work together to keep early/low-quality signals out.
How it works (components & interaction)
Pattern engine (entry candidates)
Bullish side (Cover Buy):
Body Engulf: current green body fully covers the prior red body, or
Piercing (relaxed): prior red → current green closes above the prior body’s midpoint (not beyond prior open).
Bearish side (Cover Sell):
Full-candle Engulf: current red candle (body + wicks) covers the entire prior candle, or
Body Engulf: current red body fully covers the prior body, or
Dark-Cloud (relaxed): prior green → current red closes below the prior body’s midpoint.
Short-term trend gate (non-repainting)
Trend is defined by the EMA slope between bar-1 and bar-2, scaled by ATR to require minimum strength.
Slope < 0 → only bullish candidates pass. Slope > 0 → only bearish candidates pass.
Body-size filter (noise control)
Rejects tiny candles: each body is compared with the lookback average body size.
For bearish candidates an additional ratio check requires current body ≥ a fraction of the prior body (to avoid weak top-ticks).
Peak filters for bearish signals (late, cleaner tops)
Distance above EMA: the high must be at least X × ATR above EMA (avoids mid-range noise).
Near local high: the high of the current bar (or bar-1) must be close to the highest high in a recent window.
Break confirmation: close must break low by at least Y × ATR (filters shallow dark-clouds).
Only when a candidate satisfies the pattern ➝ trend ➝ size ➝ peak sequence is a signal printed/alerted.
Inputs (key parameters)
EMA length, Min EMA slope vs ATR, ATR length: trend strength.
Lookback for average body, Min body vs average, Bear body ratio: body-quality filters.
High distance above EMA (×ATR), Local high lookback, Tolerance to local high (×ATR), Min break of low (×ATR): bearish peak confirmation.
Alerts
Built-in alerts fire on bar close for both Cover Buy and Cover Sell.
How to use
Increase High distance above EMA / Local high lookback / Min break of low to reduce early Cover Sell in ranges.
If you miss good tops, ease those thresholds slightly.
Works across symbols/timeframes; evaluated on bar close; no repaint from the trend gate.
Notes
This tool is a signal screener, not financial advice. For best results, combine with your structure/SR zones, risk management, and execution rules.
Crypto Breakout Buy/Sell Sequence
⚙️ Components & Sequence Multiple Timeframe (What It Does)
1. Bollinger Bands – Form the foundation by measuring volatility and creating the dynamic range where squeezes and breakouts occur.
2. Squeeze Dots – Show when price compresses inside the bands, signaling reduced volatility before expansion.
3. Breakout Event (Brk Dot) – Fires when price expands beyond the squeeze zone, confirming volatility expansion. (This paints Intra, before candle close)
4. Buy Signal – Confirms entry after a breakout is validated. (This paints at candle close)
5. Pump Signal – Flags sudden surges that extend sharply from the bands, often linked to strong inflows.
6. Momentum Stream – Tracks the strength of movement following the breakout, from continuation (🟢) to slowing (🟡) to exhaustion (🔴). (Resets at Pump Signal)
7. Overbought Indicator – Confirms when momentum has reached overheated conditions, often aligning with band extremes.
8. Sell Signal – Prints when exhaustion/reversal conditions are met, closing the trade cycle.
The Crypto Breakout Buy/Sell Sequence is a no-repaint event indicator that maps a full trade cycle using Bollinger-band-based volatility states: Bollinger Bands → Squeeze → Breakout → Buy → Pump → Momentum → Top Test → Overbought → Sell. Each stage is rule-based and designed to be read on standard candlesticks.
How It Works (System Logic)
Volatility framework: Bollinger Bands define dynamic range and compression/expansion.
Initiation: Squeeze → Breakout confirms expansion; Buy validates participation after expansion begins.
Management: Pump highlights unusual acceleration; Momentum stream tracks continuation → slowing → exhaustion.
Exhaustion/Exit: Top Testing + Overbought build the exhaustion case; Sell marks the sequence end.
How To Use (Quick Guide)
Wait for Squeeze → Breakout → Buy to establish a structured start.
Manage with Momentum:
🟢 continuation, 🟡 slowing, 🔴 exhaustion pressure.
Monitor extremes: Top Testing and/or Overbought = tighten risk.
Exit on Sell or on your risk rules when exhaustion builds.
Limitations & Good Practice
Signals reflect price/volatility behavior, not certainty.
Strong trends can remain extended; Overbought/Top Test ≠ instant reversal.
Always confirm with your own risk rules, position sizing, and market context.
Initial public release: integrated Squeeze/Breakout/Buy → Momentum → Exhaustion → Sell cycle; improved label clarity; cleaned defaults.
Disclaimer
For educational purposes only. Not financial advice. Past performance does not guarantee future results. Test before live use.
Thank You

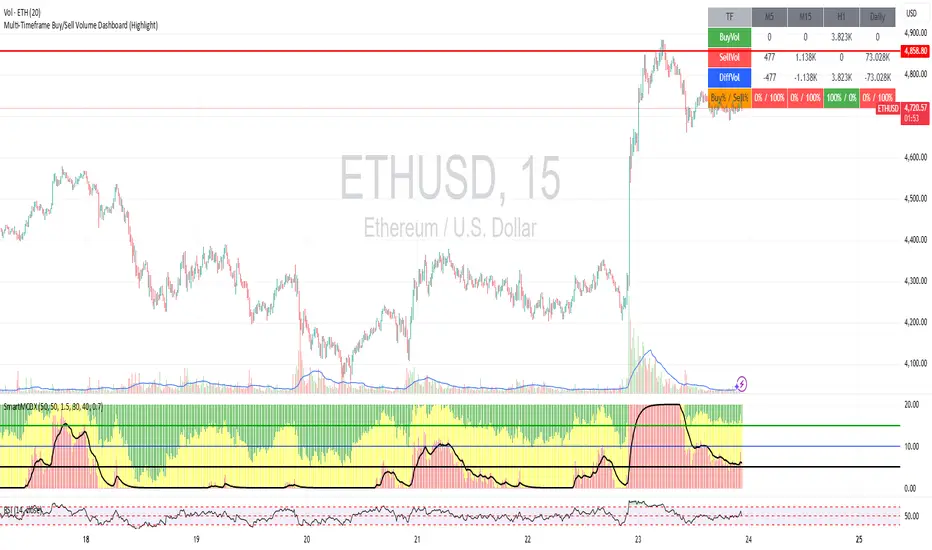
Multi-Timeframe Buy/Sell Volume Dashboard (Highlight)🔹 Results:
✅ M5, M15, H1, Daily in one dashboard
✅ Buy/Sell/Difference/Buy% vs Sell% are all clear
✅ The dominance box will change color according to who is dominant:
Green → Strong buyer
Red → Strong seller
Yellow → Balanced
XAUUSD 1H – FVG Buy/Sell Signals XAUUSD 1H – Fair Value Gap (FVG) Buy/Sell Signals (No Boxes)
What it is:
A clean, signal-only indicator for Gold on the 1-hour chart. It detects 3-bar Fair Value Gaps, waits for a deep retest, then confirms with strong candle structure + trend + ADX before printing a BUY/SELL arrow. No rectangles or clutter—just selective, high-quality signals.
Why it works:
Instead of chasing breakouts, the script hunts for imbalances (FVGs) where price often returns to “fair value.” It only fires when:
price revisits the gap by a configurable depth,
the candle closes beyond the far edge with a small buffer,
the candle body is ≥ ATR × K (confirms intent),
the broader trend (EMA-50/EMA-200) agrees, and
ADX (Wilder, manual) shows sufficient strength.
Key features
✅ Signal-only: arrows/labels—no boxes on chart.
✅ Deep retest logic (percentage of zone), not just a touch.
✅ Strong close filter (edge + buffer) + ATR body filter.
✅ Trend filter (EMA-50 vs EMA-200) to keep trades with the regime.
✅ ADX strength to avoid chop.
✅ One signal per zone (optional “delete on use”).
✅ Alerts for both BUY and SELL.
✅ Built for Pine v6, non-repainting logic on bar close.
Inputs you can tune
Min FVG size (pts) – ignore tiny gaps.
Retest depth (%) – how deep price must come back into the gap.
Close buffer (pts) – extra confirmation beyond zone edge.
Min body ≥ ATR× – candle strength requirement.
Min ADX – trend strength threshold.
Expire after X bars – keep zones fresh.
Delete zone after signal – true = one-shot signals.
How I use it
Apply to XAUUSD 1H.
Keep default filters for selective signals.
For more setups, lower Min FVG size or ADX and reduce retest depth; for stricter signals, do the opposite.
Combine with S/R or session timing (London/NY) for added confluence.
Notes
Signals are generated on bar close.
Designed for clarity and discipline—fewer, cleaner arrows over constant noise.
Works on other symbols/timeframes, but tuned for Gold 1H.
Tags: #XAUUSD #Gold #FVG #SmartMoney #1H #TrendFollowing #ADX #ATR #PineV6 #TradingView

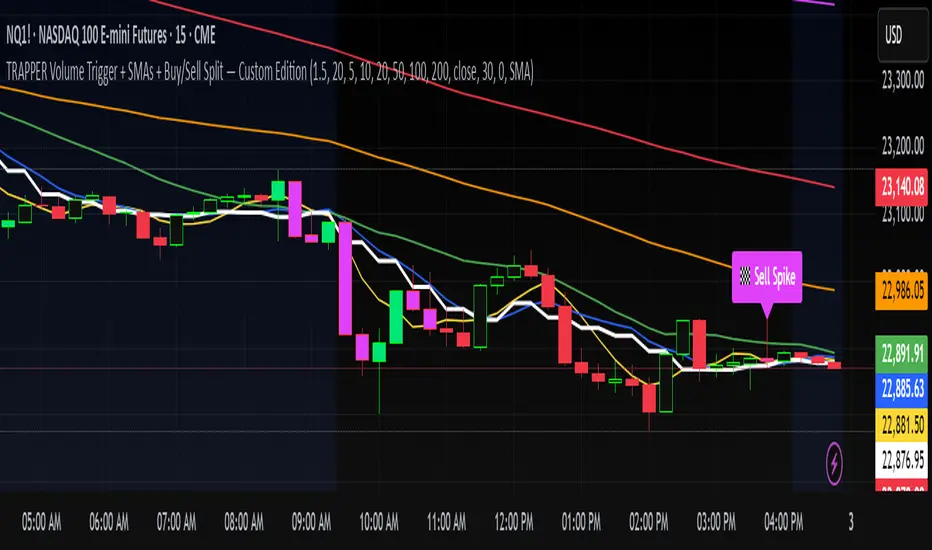
TRAPPER Volume Trigger + SMAs + Buy/Sell SplitThe TRAPPER TRIGGER is a precision-based volume spike indicator designed for intraday traders, scalpers, and swing traders who rely on key volume activity to anticipate sharp market movements. It operates on volume delta logic, detecting disproportionate buying or selling activity that signifies potential market reversals or breakouts.
How It Works:
Volume Spike Logic (Delta-Based)
The script calculates a dynamic volume threshold using a moving average of historical volume data.
It identifies a delta spike by comparing current volume against this threshold—when volume exceeds it significantly, it suggests abnormal activity.
If the candle closes higher than it opens (bullish), the script registers it as a Buy Spike ⚖️.
If the candle closes lower than it opens (bearish), it marks a Sell Spike 🏁.
These are not based on the candle’s body size but the volume differential (delta) between buy/sell pressure inferred from candle direction.
Trigger Labels
Only the most recent buy/sell spike is labeled for clarity, avoiding clutter.
Labels are color-coded to match the candle body (e.g., bright green for bullish, magenta for bearish).
Label style: ⚖️ for Buy Spikes, 🏁 for Sell Spikes.
SMA Suite (Fully Customizable):
Six SMAs: 5 (yellow), 10 (blue), 20 (green), 50 (orange), 100 (red), 200 (white).
Each can be toggled and customized in the script settings for visibility and styling.
Key Benefits
Clean, minimalistic charting — focuses only on high-probability events.
Provides delta-driven insights without requiring access to full L2 order book data.
Works across any timeframe — logic recalculates and resets zones per timeframe switch.
Designed for sniper-style entries—ideal for traders who prefer minimal noise and maximum signal clarity.
Easily extendable with SR zones, AVWAP, liquidity levels, or alerts if desired in future updates.
Who It’s For
Scalpers and intraday traders looking for clean triggers.
Swing traders wanting confirmation of institutional moves.
Volume profile enthusiasts who need a trigger alert system.
Developers who want a base volume framework to build more advanced tools on.
Disclaimer
This script is provided as-is and is intended for educational and informational purposes only. It does not constitute financial advice, investment recommendations, or a solicitation to buy or sell any security or asset.
All trading involves risk. Users should perform their own due diligence and consult with a qualified financial advisor before making any trading decisions. The author of this script assumes no liability for any losses or damages arising from the use or reliance on this tool.
By using this script, you acknowledge and agree that you are solely responsible for your own trading decisions and outcomes.
TradeDots - Buy Sell Signals ProThe TradeDots - Buy Sell Signals Pro is an advanced technical analysis tool engineered to identify key market turning points and trend continuations. By combining multiple confirmation methods, this indicator provides traders with a comprehensive system for recognizing high-probability entry and exit points across various market conditions.
📝 HOW IT WORKS
Enhanced Supertrend Implementation
Unlike the traditional Supertrend indicator that simply changes color when price crosses above or below a calculated line, our implementation incorporates multiple layers of confirmation:
Advanced Calculation: Uses an enhanced ATR-based algorithm that incorporates trend bias detection and momentum filtering
Multi-Factor Confirmation: Considers price interaction with previous Supertrend values, not just current crossovers
Contextual Awareness: Distinguishes between different entry types based on market risk levels and momentum conditions
Visual Enhancement: Provides background shading to clearly indicate trend direction and strength
Smart Trendline Algorithm
The indicator employs a proprietary Smart Trendline that adapts to market conditions using an advanced moving average system. Unlike traditional moving averages that simply track price, the Smart Trendline incorporates volatility data to change colors based on momentum strength, providing immediate visual feedback about the current market phase with zero lag.
Calculation: Processes price data through selectable advanced calculation methods (including Hull, Jurik, and McGinley averages) with dynamic color-coding based on a modified Keltner Channel system.
Visualization: Green indicates strong bullish momentum, purple represents bearish momentum, and gray signals consolidation or uncertain conditions.
Multi-Signal Confirmation System
The indicator integrates three distinct signal mechanisms to confirm trading opportunities:
1. RSI-Sequential Reversal Signals: Combines RSI levels with seq count patterns to identify potential short-term reversals.
Calculation: Analyzes RSI conditions against specific thresholds while tracking consecutive pattern formations.
Visualization: Green triangles for buy signals and red triangles for sell signals.
2. Statistical Reversal Signals: Identifies statistically significant deviations from normal price behavior.
Calculation: Uses a modified standard deviation approach to determine when price has moved too far from its statistical average.
Visualization: Large green arrows emoji for powerful buy signals and red arrows emoji for powerful sell signals.
3. Supply & Demand Zone Detection: Automatically identifies key price levels where significant buying or selling pressure may exist.
Calculation: Uses RSI extremes combined with confirmation periods to establish high-probability reversal zones.
Visualization: Green-filled areas mark support (demand) zones and red-filled areas mark resistance (supply) zones.
Buy/Sell Signal Generation
The system generates several types of signals with varying strengths:
1. Regular Buy/Sell Signals: Generated when:
Price crosses with MA above/below the Supertrend line
RSI conditions confirm the direction
Candlestick patterns support the signal direction (bullish/bearish candle formation)
Visualized as green/red triangles
2. Strong Buy/Sell Signals: Appear when multiple confirmation factors align:
Regular buy/sell condition is met
Price is interacting with a Supply/Demand zone
Additional momentum confirmation from auxiliary indicators
Seq count reaches significant levels
Statistical Reversal signal confirms the direction
3. Breakout Signals: Special case signals that appear during:
Trend transitions after consolidation
When price breaks through significant resistance/support levels from previous trend
Following pattern completions that suggest increased momentum
Market Structure Analysis
The indicator categorizes market conditions and provides visual cues for traders:
Trend Identification: Supertrend-based algorithm with enhanced visual presentation identifies the prevailing market direction.
Bar Coloring System: Candles change color based on price position relative to EMAs to clearly display strength and direction of momentum
🛠️ HOW TO USE
Signal Interpretation
Buy Signals: "Buy" signals, Green triangles (RSI-Sequential) and large green arrows (Statistical Reversals) appear at potential buy points.
Sell Signals: "Sell" signals, Red triangles (RSI-Sequential) and large red arrows (Statistical Reversals) appear at potential sell points.
Highest Probability Entries: Occur when signals appear near or within Supply & Demand zones.
Trading Strategies
Trend-Following Strategy
1. Identify the main trend using the Smart Trendline color
2. Enter long positions during uptrends when:
Price pulls back to the Smart Trendline
Green triangles or arrows appear
Signals occur near green demand zones
3. Enter short positions during downtrends when:
Price bounces up to the Smart Trendline
Red triangles or arrows appear
Signals occur near red supply zones
Counter-Trend/Reversal Strategy
1. Look for Statistical Reversal arrows at significant price extremes
2. Confirm with an RSI-Sequential signal in the same direction
3. Pay special attention when these signals appear inside Supply & Demand zones
4. Use the Smart Trendline color change as additional confirmation
Multiple Confirmation Technique
For highest probability trades, look for:
Signal alignment (both signal types in same direction)
Supply/Demand zone interaction
Smart Trendline color supporting the signal direction
❗️LIMITATIONS
Signal Lag: The system identifies reversals after they have begun, potentially missing the absolute bottom or top.
False Signals: Can occur during periods of high volatility or range-bound markets.
Timeframe Sensitivity: Some signals work better on higher timeframes for long-term trading, while others are more effective on lower timeframes for short-term trading.
Bar Closing Requirement: All signals are based on closed candles and may be subject to change until the candle closes.
RISK DISCLAIMER
Trading involves substantial risk, and most traders may incur losses. All content, tools, scripts, articles, and education provided by TradeDots are for informational and educational purposes only. Past performance is not indicative of future results.
This indicator should be used as part of a complete trading approach that includes proper risk management, consideration of the broader market context, and confirmation from price action patterns. No trading system can guarantee profits, and users should always exercise caution and use appropriate position sizing.
